Real estate dashboards simplify decision-making by turning overwhelming data into clear visuals and real-time metrics. They pull information from CRMs, property databases, and financial tools, helping professionals cut property valuation times, boost lead conversion rates, and streamline operations. Each sector uses dashboards differently:
Integrations with CRMs, property databases, and tools like Zapier enhance functionality, while AI-powered systems provide faster insights and improved response times. Many firms achieve this by implementing AI answering for real estate to handle inquiries instantly. The right dashboard transforms raw data into actionable insights, tailored to the needs of agents, investors, and property managers.
Residential real estate dashboards are designed to keep a close eye on the factors that drive sales and boost agent efficiency. At the heart of these dashboards is lead management - tracking metrics like new leads, conversion rates, average closing times, and sale prices. This helps pinpoint where potential buyers or sellers drop off in the process. Agent performance is another critical focus, with measurements such as client meetings scheduled, offers made, deals closed, average commission per transaction, and client satisfaction scores.
Market positioning plays a significant role as well. Metrics like time-on-market and hyperlocal sales comparables (properties sold within 0.5 miles over the past 60 days) provide immediate pricing insights. On the financial side, dashboards track rental income versus operating costs, net operating income (NOI), and the return on investment (ROI) from advertising spend - helping identify the most effective marketing channels.
These dashboards cater to a variety of users across the real estate ecosystem:
By tailoring insights to each user group, these dashboards enable smarter, faster decision-making.
Modern dashboards seamlessly integrate with tools like CRM platforms, including Follow Up Boss and LionDesk, to streamline data organization and minimize errors. They also connect with property databases and valuation APIs, automating tasks like comparative market analysis. A notable example is the Levi Rodgers Real Estate Team, which in 2026 integrated an AI-powered dashboard with Follow Up Boss and Dotloop. This system automated hyperlocal sales comparables, cutting comp preparation time from 25 minutes to under 5 minutes and saving leadership 3–5 hours weekly.
Additionally, Zapier integration connects dashboards with over 9,000 apps, such as Google Calendar and Outlook, enabling automated workflows. This is particularly valuable since half of all buyer inquiries come in after business hours or on weekends. With robust systems in place, agents can address these inquiries promptly, avoiding the loss of up to 70% of leads within the first 72 hours.
The integration of real-time data into these dashboards has a transformative effect on decision-making. By providing instant insights, they allow leadership to move from reactive problem-solving to proactive strategizing. For instance, in April 2025, an international brokerage with 220,000 monthly visitors adopted an AI-powered system that delivered "Agent Insights" briefs before consultations. This led to dramatic results:
| Metric | Before AI Dashboards | After AI Dashboards |
|---|---|---|
| Property Valuation Time | Several hours per property | Minutes per property |
| Lead Response Time | 4+ hours | Under 90 seconds |
| Lead-to-MQL Conversion | 38.81% | 76% |
| Marketing Costs | Baseline spend | 30% reduction |
A practical example of this impact comes from Real Estate by Design in San Antonio. By incorporating AI-powered valuation tools, they saw their sales-to-list price ratio rise from 93% to 97%, and the average days on market fell from 30 to 21 within six months. These results highlight the power of data-driven decisions over instinct, as Levi Rodgers emphasized:
"In today's real-time world, you can't afford to make guesses. You need to make decisions based on what's happening now." - Levi Rodgers, CEO, Levi Rodgers Real Estate Team
Commercial real estate dashboards offer a different perspective compared to their residential counterparts, focusing on investment returns and minimizing risks. While residential tools often emphasize sales trends and agent productivity, commercial dashboards are all about ensuring financial stability and maximizing asset performance.
In the commercial real estate world, the emphasis is on financial health and risk management rather than quick sales. Key metrics include Internal Rate of Return (IRR), Capitalization Rate (Cap Rate), Net Operating Income (NOI), Debt Service Coverage Ratio (DSCR), and Equity Multiple - all essential for measuring investment returns. These dashboards also monitor operational performance through data like occupancy and vacancy rates, tenant turnover, lease renewals, and maintenance expenses, ensuring properties maintain steady income streams.
An emerging trend is the inclusion of environmental and sustainability metrics. These might track carbon footprints, energy and water usage, or compliance with certifications like LEED and BREEAM. Additionally, "dead deal analysis" is becoming popular among investors to refine future strategies by learning from unsuccessful transactions.
The primary audience for these dashboards includes institutional investors, asset managers, property managers, and developers. Each group uses the tools differently:
Modern commercial dashboards seamlessly integrate with ERP systems, CRMs like Follow Up Boss, property databases, and even IoT devices for real-time facility updates. This connectivity eliminates data silos, ensuring instant access to updated information.
For instance, Hitch, a home equity lender, implemented Clear Capital's ClearAVM™ - an AI-powered Automated Valuation Model - and saw a 30% boost in loan approvals thanks to more accurate, real-time valuations.
These dashboards also work with business intelligence tools like Power BI and Tableau, automating reports that previously required hours of manual effort. Leadership teams can save 3–5 hours per week with automated pipeline updates. Predictive analytics further enhance decision-making by forecasting market trends and maintenance needs based on historical data. This integration creates a foundation for smarter, faster decisions.
Switching from static monthly reports to real-time dashboards has revolutionized how commercial real estate professionals operate. Instead of addressing issues months after they arise, managers can act immediately to resolve problems like declining occupancy rates. Asset managers, too, can use real-time risk metrics like sponsor exposure and DSCR to proactively adjust portfolios, avoiding surprises during quarterly reviews.
Firms using AI-powered models have reported over 10% gains in net operating income, driven by better tenant retention and smarter asset choices. With the ability to process tens of thousands of records per hour, these tools enable hyperlocal insights that were once impossible to achieve manually. By replacing gut instincts with data-backed decisions, commercial teams can allocate resources more effectively and adapt to market changes with confidence.
Rental dashboards are designed to streamline operations and improve tenant retention by tracking key metrics like occupancy rates, lease renewals, maintenance response times, and lead conversion. They also provide insights into financial performance, including total rental income, operating costs, and net operating income (NOI). Operational details, such as service requests and average response times, are monitored to help reduce tenant turnover.
Similar to residential and commercial dashboards, rental dashboards turn raw data into actionable insights. Property managers keep a close eye on vacancy rates, lease terms, and rent per square foot while comparing their assets to regional market benchmarks. Marketing performance is also a focus, with metrics like lead-to-MQL conversion rates, inquiry response times, and advertising expenses under constant review.
A noticeable trend is the adoption of sustainability metrics, such as energy and water usage and carbon footprint measurements, to align with green building standards.
One example of this approach in action comes from April 2025, when an international real estate brokerage adopted Dialzara's AI Agent system. By automating lead qualification with a $50,000 minimum budget threshold, the firm increased its consultation booking rate from 26% to 43% and slashed response times from 4 hours to under 90 seconds.
Rental dashboards are primarily used by property managers, landlords, real estate investors, and facility managers. Property managers utilize these tools to manage maintenance schedules and track lease expirations, while investors monitor portfolio returns and tenant retention rates. These dashboards are critical for ensuring smooth operations and making timely decisions.
Modern rental dashboards are built to integrate seamlessly with CRMs like Follow Up Boss, property management systems, and communication tools such as WhatsApp and email. Real-time syncing ensures unit availability is always up-to-date, while platforms like Zapier offer connections to over 9,000 apps, automating alerts for leads and maintenance tasks.
For handling high volumes of inquiries, My AI Front Desk offers 24/7 AI receptionists capable of managing calls, texts, and emails. Features like unlimited parallel calls, integrated texting workflows, and Google Calendar syncing make it easier to schedule tours and capture leads. This is especially useful since nearly 50% of inquiries occur outside of regular business hours. These integrations reflect the industry's growing reliance on real-time data to improve decision-making across the real estate sector.
With robust metrics and advanced integrations, rental dashboards empower property managers to make proactive decisions. Instead of reacting to issues like declining occupancy months later, real-time dashboards allow immediate action. Companies using AI-driven tools have reported NOI increases of over 10%.
"In today's real-time world, you can't afford to make guesses. You need to make decisions based on what's happening now."
- Levi Rodgers, CEO, Levi Rodgers Real Estate Team
Dashboards also support dead deal analysis, helping managers identify why rental applications fall through so they can refine their screening and marketing strategies. By consolidating data on maintenance expenses, lease expirations, and lead sources, rental teams can allocate resources more effectively and stay agile in a constantly changing market.
Comparison of Residential, Commercial, and Rental Real Estate Dashboard Features
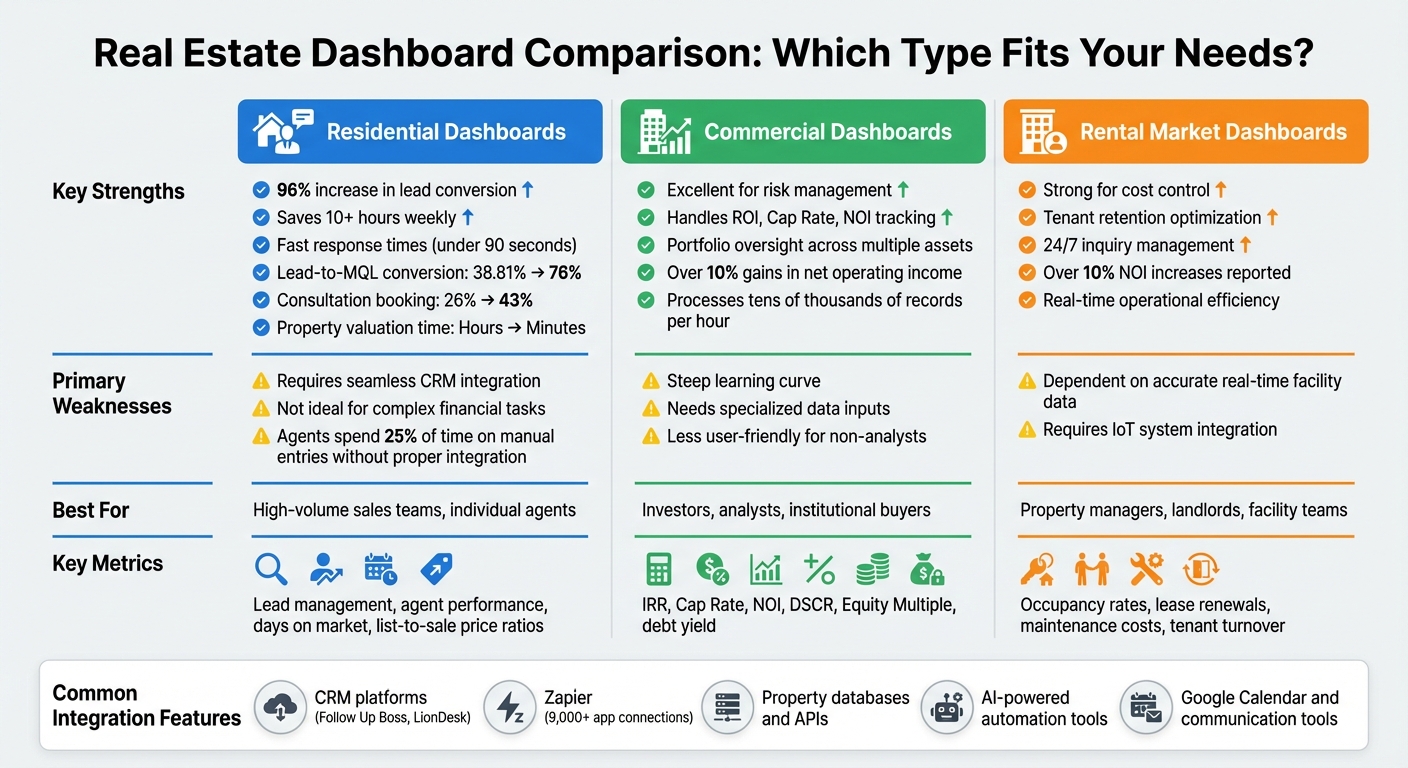
Different dashboard types offer unique benefits and challenges, depending on their application in real estate. Residential dashboards are excellent for tracking speed-to-lead metrics and agent productivity. For instance, they can cut valuation times from 25 minutes to under 5 minutes. However, their performance is heavily dependent on flawless CRM integration. Without it, agents may spend up to 25% of their time on manual entries, which dramatically reduces efficiency.
Commercial dashboards, on the other hand, excel in handling complex financial modeling and risk management. They provide detailed tracking of debt metrics like DSCR (Debt Service Coverage Ratio) and debt yield across various asset classes, making them an invaluable tool for capital allocation decisions. The downside? These systems often require specialized financial data inputs and can be less user-friendly for those without an analytical background.
Rental market dashboards focus on operational efficiency and tenant retention. They offer real-time visualization of the gap between rental income and operating costs, enabling property managers to reduce tenant turnover and skyrocket sales leads through improved communication. Their effectiveness, though, hinges on precise, real-time data from facilities and IoT systems.
| Dashboard Type | Key Strengths | Primary Weaknesses | Best For |
|---|---|---|---|
| Residential | 96% increase in lead conversion; saves 10+ hours weekly; fast response times | Requires seamless CRM integration; not ideal for complex financial tasks | High-volume sales teams, individual agents |
| Commercial | Excellent for risk management; handles ROI, Cap Rate, and portfolio oversight | Steep learning curve; needs specialized data inputs | Investors, analysts, institutional buyers |
| Rental | Strong for cost control, tenant retention, and 24/7 inquiry management | Dependent on accurate, real-time facility and IoT data | Property managers, landlords, facility teams |
Integration is a common thread across all dashboard types. The ability to connect seamlessly with CRMs like Follow Up Boss or tap into Zapier’s ecosystem of over 9,000 apps can dramatically enhance their utility. For rental operations dealing with high inquiry volumes, platforms such as My AI Front Desk offer features like unlimited simultaneous calls and Google Calendar syncing, ensuring no lead slips through the cracks. Ultimately, the success of these dashboards depends on how well they integrate with existing tools, combining data to deliver clear, actionable insights.
Dashboard solutions cater to different needs depending on the sector. Residential dashboards shine in lead response and conversion, commercial dashboards handle intricate investment analysis, and rental dashboards focus on operations and tenant retention.
When choosing a system, align it with your primary challenge. If rapid lead response is your priority, look for platforms offering 24/7 engagement tools. Residential agents should consider dashboards that integrate effortlessly with their CRM and provide hyperlocal market comparisons within minutes. For commercial investors, platforms that consolidate data for "dead deal analysis" and refine investment criteria are key.
A balanced approach works best - adopt a "2x2" strategy: tackle two immediate-use cases (like automating lead follow-ups) while also planning for two long-term goals (such as predictive modeling). This ensures you achieve quick wins while laying the groundwork for sustained growth. It’s worth noting that 70% of success stems from strong organizational culture and staff training, not just the technology itself. For rental operations managing high inquiry volumes, tools like My AI Front Desk can handle unlimited simultaneous calls and integrate with Google Calendar, ensuring no lead slips through the cracks.
Ultimately, the right dashboard transforms raw data into actionable insights. By blending data synthesis with seamless integration, these tools empower better decision-making. Whether you're tracking agent performance, managing a commercial portfolio, or streamlining rental operations, choose a system that complements your existing tools and addresses your unique workflow needs.
In real estate, tracking the right metrics can make all the difference in improving efficiency and staying ahead of the competition. Some of the most important metrics to monitor include:
For investors and property managers, market performance indicators are just as critical. Metrics like rental occupancy rates and portfolio trends provide insight into the health of the market and guide investment strategies.
AI-powered dashboards take these metrics to the next level by automating processes like lead response and property valuation. This not only saves time but also helps professionals remain competitive and focused on delivering results.
A real estate dashboard needs to connect with tools that streamline day-to-day operations and improve lead management. Some essential integrations include a CRM system to keep leads and contacts organized, property management systems to provide real-time data updates, and scheduling tools for effortless appointment setting. Incorporating communication platforms - like email, SMS, and phone systems - helps ensure quick responses and enables automated workflows, boosting both customer engagement and lead conversion rates.
To gauge the return on investment (ROI) from an AI-powered dashboard, focus on the ways it improves decision-making, saves time, and contributes to revenue growth or cost reduction. Start by identifying and tracking key metrics, such as lead conversion rates, property valuation turnaround times, or customer satisfaction scores.
A practical approach is to compare outcomes before and after implementing the dashboard. For instance, measure the number of hours saved on manual tasks or the improvement in lead response rates. These comparisons can help you clearly see how the tool impacts efficiency, boosts revenue, and enhances overall business performance.
Start your free trial for My AI Front Desk today, it takes minutes to setup!


