In the telecom world, analytics is all about gathering the massive streams of data flowing through a network, making sense of it, and using those insights to fine-tune performance, keep customers happy, and grow the business. It’s the process of turning raw, technical data into clear, actionable intelligence that people can actually use to make better decisions.
Think about it: a modern telecom provider is the digital backbone of our society. Every text, every video stream, every online transaction creates a tidal wave of data. With 5G, the Internet of Things (IoT), and endless streaming, that wave is now a tsunami. Without a smart way to process it all, that data is just noise. This is where telecom analytics steps in, acting as the central nervous system for the entire operation.
Imagine a telecom network as a city’s highway system during rush hour. Analytics is the traffic command center, watching everything in real-time. It spots congestion building up before it causes a major slowdown, instantly rerouting data packets to keep traffic flowing smoothly. It’s what ensures your high-definition video call doesn't freeze and your text messages arrive instantly.
The amount of data generated every single day is mind-boggling—a single cell tower can churn out terabytes of information. Hidden inside that data are clues to almost every part of the business.
By transforming this flood of data into structured insights, telecom companies can finally shift from being reactive to proactive. Instead of scrambling to fix problems after they’ve already frustrated customers, they can prevent them from ever happening.
This isn’t just a nice-to-have advantage anymore; it’s a basic requirement for survival. As networks get more complex and customer expectations get higher, the ability to effectively use data is what separates the industry leaders from everyone else. Analytics provides the clarity needed to navigate this environment, ensuring the network stays reliable, customers stay satisfied, and revenue continues to grow.
To really get a handle on analytics in telecom, it's best not to think of it as one single thing. Instead, picture it as a team of specialists working in perfect sync. Each type of analytics plays a specific role, focusing on a different slice of the business to keep the whole operation humming. Think of it like a high-performance pit crew—every member is crucial to winning the race.
This infographic shows how raw data gets turned into smart business decisions.
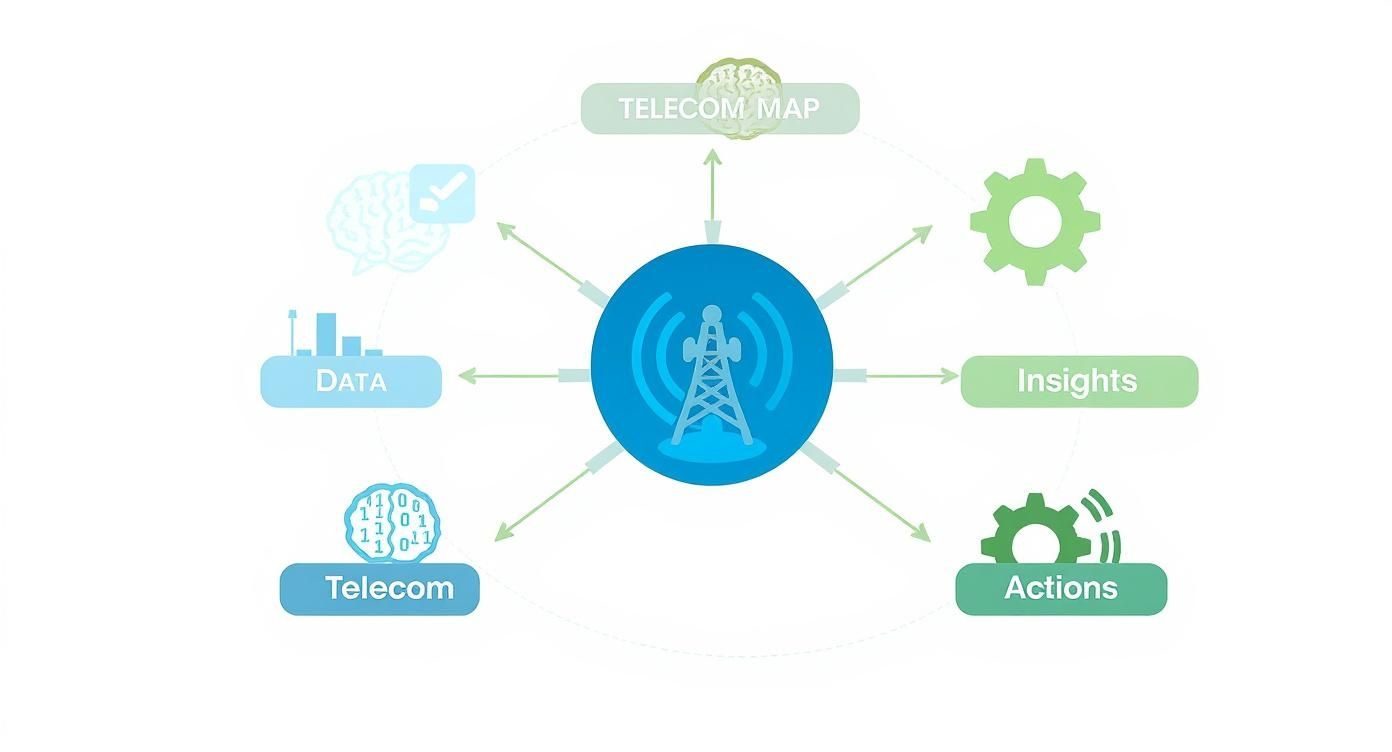
You can see a clear path here, from grabbing the raw data all the way to taking targeted action that improves the bottom line.
To make this clearer, let's break down the four key pillars that hold up a modern telecom analytics strategy. They each have a unique job but work together to create a powerful, data-driven operation.
Now, let's unpack what each of these really does on the ground.
At its heart, a telecom company is managing an unimaginable flow of digital traffic. Network analytics is the air traffic control for all that data, keeping an eye on everything from call quality to internet speeds in real time. Its main job is to make sure every data packet gets where it's going, fast and without a hitch.
By digging into performance data from cell towers, routers, and switches, network analytics can spot potential bottlenecks before they cause chaos. For instance, it might notice a spike in data usage during a major concert and automatically allocate more bandwidth to that area. It's all about proactive management to prevent dropped calls and buffering videos.
While network analytics keeps the digital pipes clear, customer analytics is all about the people using them. Think of it as a super-savvy personal shopper who watches customer behavior to figure out their needs, wants, and frustrations. This goes way beyond just looking at call logs.
Understanding how things like CRM and automation solutions feed into this process is key to getting a full picture. By analyzing data points like app usage, support tickets, and even social media chatter, providers can get a shockingly deep understanding of their user base.
This insight fuels incredibly targeted actions:
By understanding why customers do what they do, telcos can forge stronger relationships and slash churn—a massive drain on profitability.
Behind every crystal-clear call is a colossal physical operation—thousands of technicians, trucks, and pieces of gear. Operational analytics is the logistics mastermind that keeps this complex machine running like a Swiss watch.
This is all about optimizing internal processes to save time and money. It tackles the tough questions: Which cell tower needs maintenance first? What's the fastest route for a field technician? How much spare equipment should we keep in the warehouse to avoid shortages without tying up cash?
For example, a telco can use predictive models to schedule maintenance on network hardware right before it’s likely to fail. That one simple move prevents a costly, customer-infuriating outage. It transforms the whole maintenance game from reactive firefighting to a smooth, proactive system.
Last but not least, Revenue and Fraud Analytics acts as the company’s elite financial security detail. It has a dual mission: protect the company from scammers and spot new ways to grow revenue. In an industry where fraud can get seriously sophisticated, this is a non-negotiable function.
This arm of analytics is always scanning for suspicious activity that points to fraud, like:
On the "revenue assurance" side, it makes sure every single service delivered is accurately billed and paid for. It helps shape pricing strategies that are both competitive and profitable, securing the company's financial future. Together, these four pillars work in concert, turning mountains of raw data into a powerful engine for reliability, customer happiness, and financial success.
Getting into telecom analytics is more like a journey than flipping a switch. You move through four distinct stages, with each level building on the last to pull deeper insights and create more business value. Think of it like a doctor diagnosing a patient: you start with simple observations and build up to a sophisticated, proactive treatment plan.
This structured approach is everything in an industry built on data. The global telecom analytics market is already valued at around USD 7.07 billion, which shows just how serious this data-driven shift is. As networks get bigger and more complex, the hunger for smarter insights is only growing. Projections show the market soaring to USD 16.21 billion by 2030.
The first and most fundamental stage is Descriptive Analytics. This level answers the simple question: "What happened?" In our doctor analogy, this is like taking a patient's vital signs—checking their temperature, blood pressure, and heart rate. It gives you a clear, factual snapshot of what’s going on right now.
For a telecom provider, this means digging into historical data to understand past performance. Dashboards will light up with key performance indicators (KPIs) like:
This stage won’t tell you why something happened. But it does get your raw data organized into a readable format, which is the essential foundation for any deeper analysis.
Once you know what happened, the next obvious question is, "Why did it happen?" Welcome to Diagnostic Analytics. Our doctor is now moving past the basic vitals and running more specific tests—like blood work or an X-ray—to find the root cause of the patient's symptoms.
In a telecom context, this means drilling down into the data to find the story behind the numbers. For instance, if descriptive analytics showed a spike in dropped calls (the "what"), diagnostic analytics investigates the "why." It might uncover that a single faulty cell tower in a high-traffic area was the culprit. It's all about connecting a symptom to its source.
Diagnostic analytics is the bridge between seeing a problem and truly understanding it. It gets a team from just knowing an issue exists to pinpointing exactly what caused it—the first real step toward a solution.
The third level, Predictive Analytics, is where things get really interesting. This stage answers the forward-looking question: "What is likely to happen next?" Our doctor, having diagnosed the problem, now uses their expertise and the patient's data to predict potential health outcomes, like the chance of a condition getting worse without treatment.
For telcos, this means using historical data and statistical models to see the future. This is an absolute game-changer, letting you shift from a reactive mode to a proactive one.
Common Predictive Use Cases:
Finally, we arrive at the pinnacle of analytical maturity: Prescriptive Analytics. This level provides the answer to the ultimate question: "What should we do about it?" Our doctor doesn't just predict a bad outcome; they write a prescription and lay out a specific treatment plan to get the best possible result.
Prescriptive analytics takes predictive insights and recommends concrete actions to hit a specific goal. It uses advanced algorithms and machine learning to run simulations of different scenarios and suggest the best path forward.
For example, if the system predicts a network overload in a downtown area during a festival, it won't just raise an alert. It will automatically recommend—or even execute—the rerouting of data traffic to nearby towers to prevent any service disruption. This is where analytics in telecom delivers its highest value, turning insight directly into automated, intelligent action.
To really make analytics in telecom work, you need the right ingredients and the right kitchen. It's not enough to just have data; you need a system that can collect it, process it, and serve it up in a way that helps you make smarter decisions. Think of it like a Michelin-star chef preparing a world-class meal.

The entire process kicks off with raw ingredients—the data itself—and moves through a few stages before it becomes an insightful "dish" that business leaders can actually act on.
Every single telecom operation is a goldmine of data. The real trick is knowing which sources are the most valuable and how to get your hands on them. These are the foundational ingredients for any analysis worth its salt.
You'll typically pull from a few key places:
These sources are the absolute bedrock of telecom analytics. If you don't have clean, reliable data coming from these systems, any analysis you build on top of it is going to be shaky at best.
Once you have your ingredients, you need a kitchen to cook them in. In the data world, this "kitchen" is your technology stack. Each piece of tech plays a specific role in turning all that raw data into genuine intelligence.
This is a massive area of investment globally. For instance, North America currently dominates the telecom analytics market, holding a share of over 42.5%. The region’s advanced infrastructure and sky-high smartphone use have forced major players to pour money into sophisticated analytics tools just to manage the incredible volumes of data. You can explore more about this market dominance in detail to get a sense of the competitive landscape.
The point of a tech stack isn't just to store data. It's to create a seamless workflow where raw information is refined, analyzed, and finally plated up as a clear, digestible insight.
Let's walk through the main stations in this data kitchen.
This structured flow ensures that decision-makers aren't just staring at a spreadsheet full of numbers. Instead, they get a carefully prepared report that tells the story hidden in the data, empowering them to take immediate and informed action.
Understanding the theory behind analytics in telecom is one thing, but seeing it solve real-world problems is where you really see the magic happen. All those abstract concepts become powerful tools when you apply them to tangible business challenges. This is where we move from diagrams and definitions to concrete results that actually improve customer experience and the bottom line.
To make this crystal clear, let's walk through two powerful examples. First, we'll see how a telecom provider can proactively fight customer churn. Then, we'll dig into how analytics keeps modern 5G networks running like a dream, even when they're under serious pressure.

Customer churn—the rate subscribers bail for a competitor—is one of the single biggest threats to a telecom company's health. The old saying is true: acquiring a new customer can cost five times more than keeping one you already have. This makes cutting down on churn a massive priority. Predictive analytics gives operators the tools to get ahead of the game.
Instead of just waiting for an angry customer to call and cancel, operators use analytics to spot at-risk subscribers long before they've made up their minds. The system chews through huge amounts of customer data, searching for the subtle patterns and behavioral shifts that scream "I'm about to leave!"
These warning signs might include things like:
Once the predictive model flags someone as a high-risk customer, the system can automatically kick off a proactive retention campaign.
This isn't about blasting out a generic "please stay" email. It's about precision. The analytics engine can recommend the specific offer most likely to work for that individual—whether it’s a temporary discount, a free data upgrade, or a personalized call from a specialist to solve their problem.
This targeted approach is infinitely more effective than broad, reactive campaigns. It turns a potential loss into a chance to strengthen the relationship, showing the customer that the provider actually gets their needs and values their business.
The rollout of 5G has opened the door to incredible new possibilities, but it's also made networks exponentially more complex. Managing these advanced systems demands a sophisticated level of oversight, especially when demand skyrockets. This is where analytics really shines, ensuring a smooth experience for everyone.
A critical application here is network performance monitoring. Imagine a huge sporting event or a music festival where tens of thousands of people are packed into a small area. In the old days, this was a recipe for disaster: network congestion, dropped calls, and data speeds that crawled.
With modern analytics, operators can now see these surges coming before they even start.
How Dynamic Resource Allocation Works:
This proactive optimization keeps the network stable and fast, even under the most extreme load. For customers, it means they can stream live video, post to social media, and make calls without a single hiccup. For the provider, it turns a potential PR nightmare into a powerful showcase of network reliability.
In both of these scenarios, analytics creates a fundamental shift from being reactive to being proactive. It gives telecom companies the power to solve problems before they ever affect the customer, building loyalty and a stronger, more resilient network along the way.
Trying to build a strategy for analytics in telecom isn't about buying the flashiest software off the shelf. It's about creating a practical, step-by-step roadmap that turns fuzzy goals into real business results. The trick is to start small, prove the value quickly, and then scale up intelligently. This way, you build a solid foundation for making decisions based on data, not just gut feelings.
And that journey doesn't start with technology. It starts with asking the right business questions. Without a clear purpose, any analytics project is just an expensive science experiment.
Before you touch a single byte of data, you have to answer the most important question: "What problem are we actually trying to solve?" Vague ambitions like "we want to be more data-driven" are dead on arrival. You need to get specific and focus on measurable outcomes that directly hit the bottom line.
Strong goals look more like this:
These kinds of clear targets become the north star for your entire strategy. They ensure every bit of effort is tied to a real business need and make it a whole lot easier to measure your success and show a return on investment later.
A well-defined goal acts as a filter. It helps you prioritize what's important and stops you from getting lost in a sea of interesting—but ultimately useless—data. It channels your resources into work that delivers real value.
Once you know your destination, you need to check what ingredients you have in the kitchen. A data audit is just that: taking a complete inventory of all your data sources. You need to figure out what you have, where it lives, and whether it's any good.
This process almost always uncovers hidden data silos, where valuable information is locked away in different departments, unable to talk to each other. Breaking down these silos is critical if you want a single, unified view of your customers and operations. The audit will also shine a light on any gaps, showing you what data you need to start collecting to actually hit your goals.
With clear goals and a map of your data, now you can start thinking about tools. A classic mistake is to go all-in on a massive, complex, do-everything platform right from the start. A much smarter approach is to pick technology that solves your immediate problems and can grow with you over time.
This is where cloud-based analytics has been a complete game-changer. The cloud segment is on track to grab 61.2% of the market revenue for a reason. It gives telcos the sheer scale and cost-efficiency they need to handle enormous amounts of data without having to buy racks and racks of servers upfront. You can dig deeper into how cloud solutions are transforming telecom analytics and see their impact on the market.
Alright, last step. Instead of trying to boil the ocean with a massive, company-wide rollout, kick things off with a focused pilot project. Pick one of your business goals and apply your new strategy on a small, manageable scale. This lets you work out the kinks, score some quick wins, and build momentum.
For example, you could run a pilot just to predict churn for a single, specific customer segment. A successful pilot is the ultimate proof of concept. It gives you a powerful story to tell and makes it much easier to get the buy-in you need from leadership to take the project wider. This cycle—define, audit, select, and prove—is the blueprint for turning an analytics ambition into a real competitive advantage.
Diving into telecom analytics for the first time usually brings up a few key questions. Let's clear up some of the most common points so you can get started with confidence.
It’s easy to get "analytics" and "business intelligence" (BI) mixed up—people often use them interchangeably. But they actually do very different jobs.
Think of Business Intelligence as your rearview mirror. It uses historical data to build dashboards and reports that tell you "what happened." It’s great for getting a snapshot of past performance.
Telecom analytics, however, is like your GPS. It’s forward-looking. It doesn’t just report a problem; it digs deeper to figure out "why" it happened (diagnostic), predicts "what will happen next" (predictive), and even suggests "what you should do about it" (prescriptive). While BI tells you you're stuck in traffic, analytics finds you a faster route.
You don't need a massive team or a huge budget to get real value from analytics. The secret for smaller telecom businesses is to start smart, not big. Look at the tools you already have, like your CRM or call management software—many have built-in analytics features ready to go.
The most critical first step isn't buying expensive tools; it's defining a specific, high-impact business problem to solve. Start by focusing your efforts on one clear goal, like reducing customer callbacks or improving first-contact resolution, and use the data you already have to find actionable insights.
This focused approach lets you prove the value quickly without a big upfront investment.
Ready to see how call analytics can transform your lead conversion? My AI Front Desk provides a comprehensive dashboard with actionable insights, helping you understand caller intent and optimize every interaction. See how our AI-powered solutions can boost your revenue at https://myaifrontdesk.com.
Start your free trial for My AI Front Desk today, it takes minutes to setup!


